Use Rate Index to review historical spot rates and market conditions for Canadian and cross-border lanes. These insights can help you build customer quotes, compare lane costs, and make more informed pricing decisions.
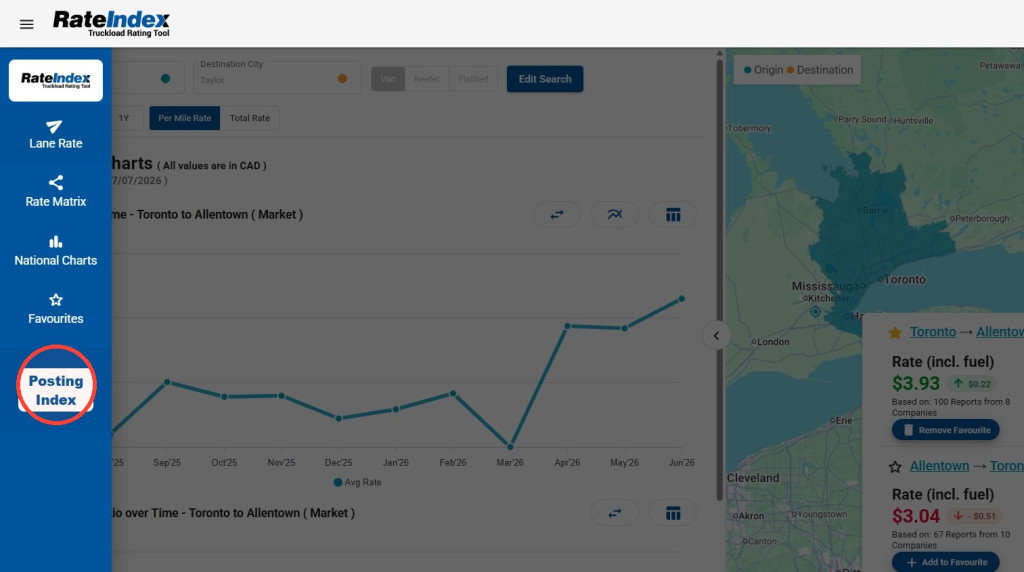
From the Loadlink dashboard, select the Rate Index summary card.
Lane Rate
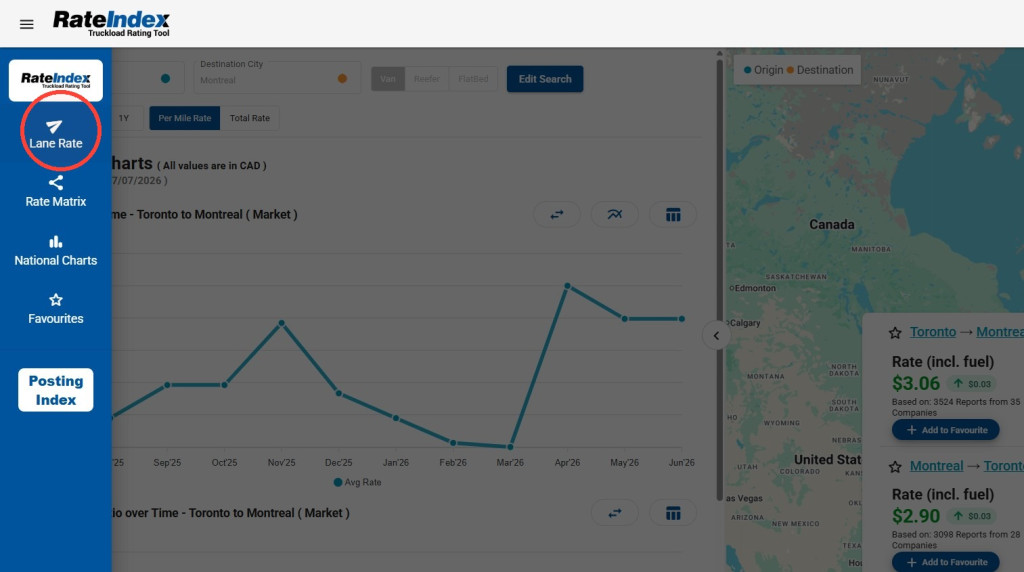
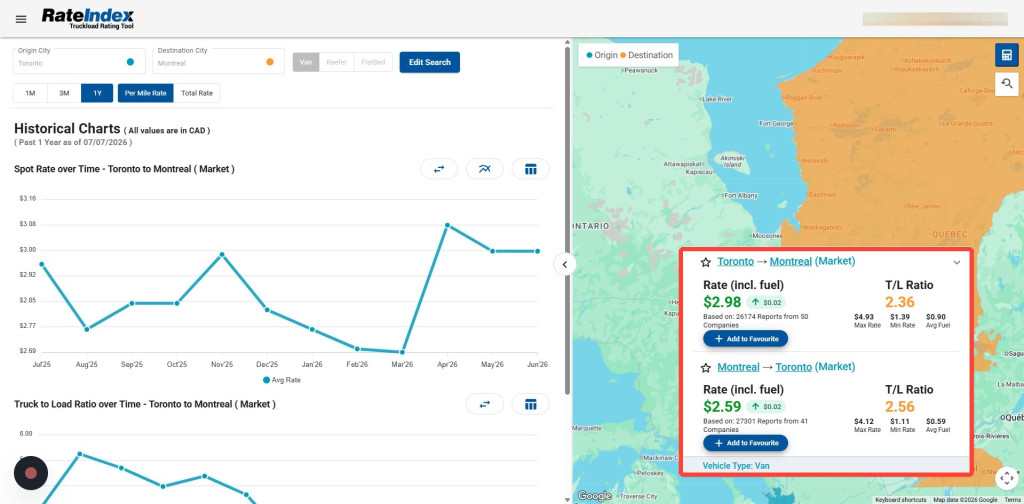
Rate Index opens to the Lane Rate workspace, where you can search a lane and review its reported rate history.
If you open Rate Index from an active Loadlink search, your origin, destination, and equipment type may be filled in automatically.
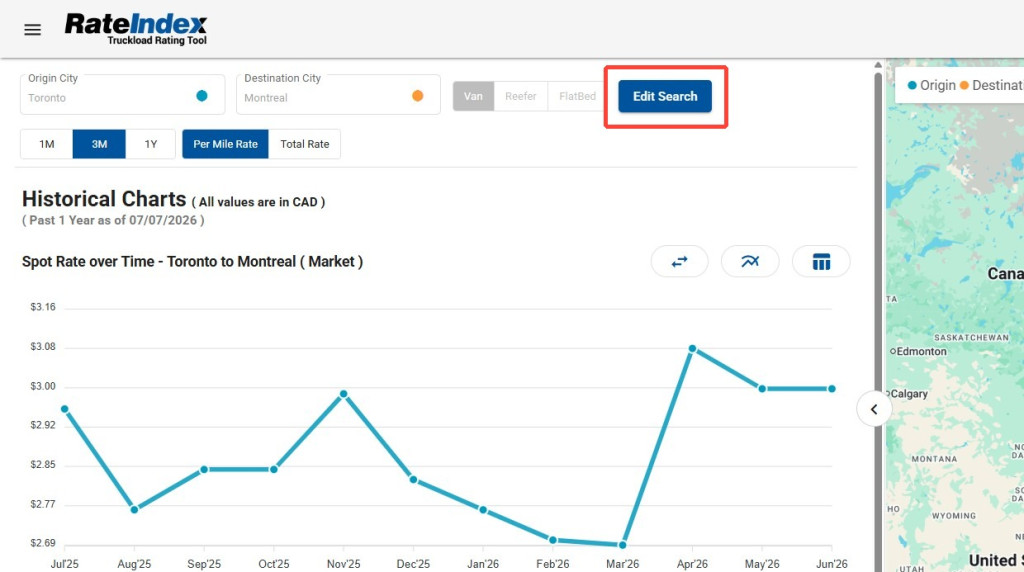
Select Edit Search to change the search details.
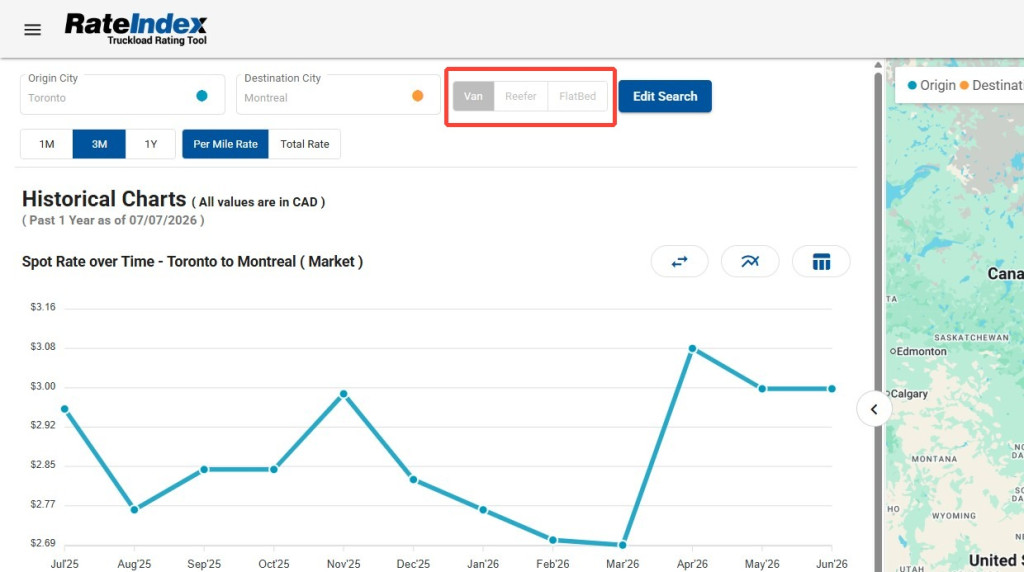
Select Van, Reefer, or Flatbed to view information for the equipment type you operate.
Read the Lane Summary
Review the lane summary for the selected route. Depending on the available data, the summary may include the average reported rate, minimum and maximum rates, number of reporting companies, rate trend, and Truck-to-Load ratio.
Calculate a Rate
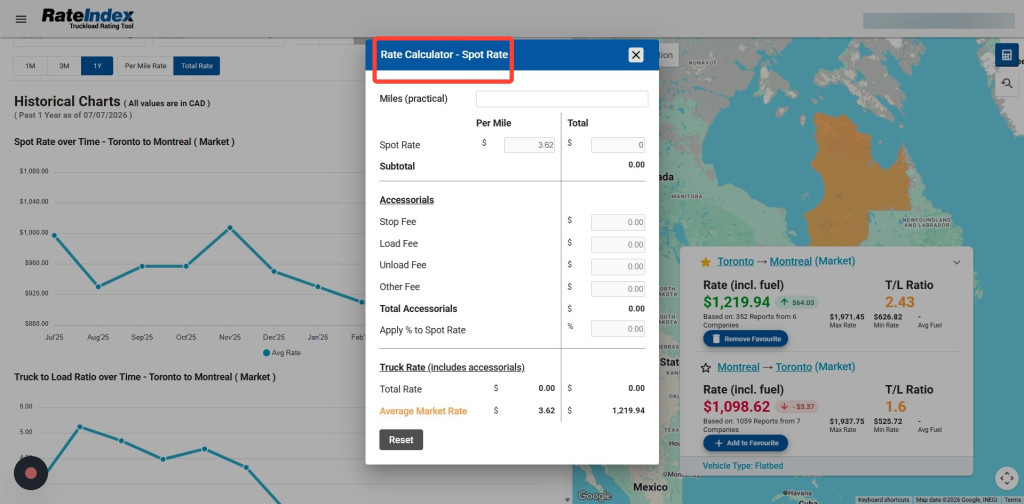
Select Rate Calculator to estimate a rate for the lane. Enter the distance, rate, and any applicable additional charges to calculate the estimated total.
Review Historical Rate Trends
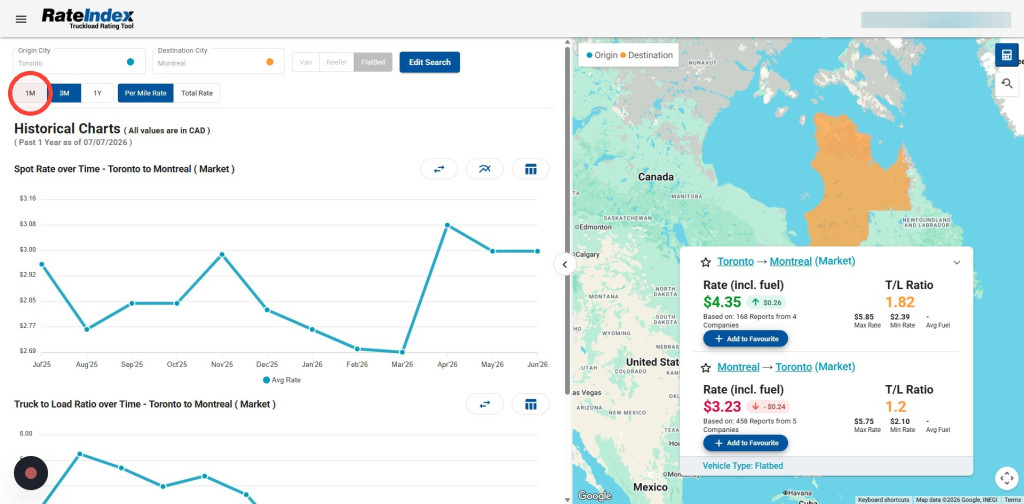
Under Historical Charts, select 1M, 3M, or 1Y to adjust the timeframe. Choose Per Mile Rate or Total Rate to change how rates are displayed.
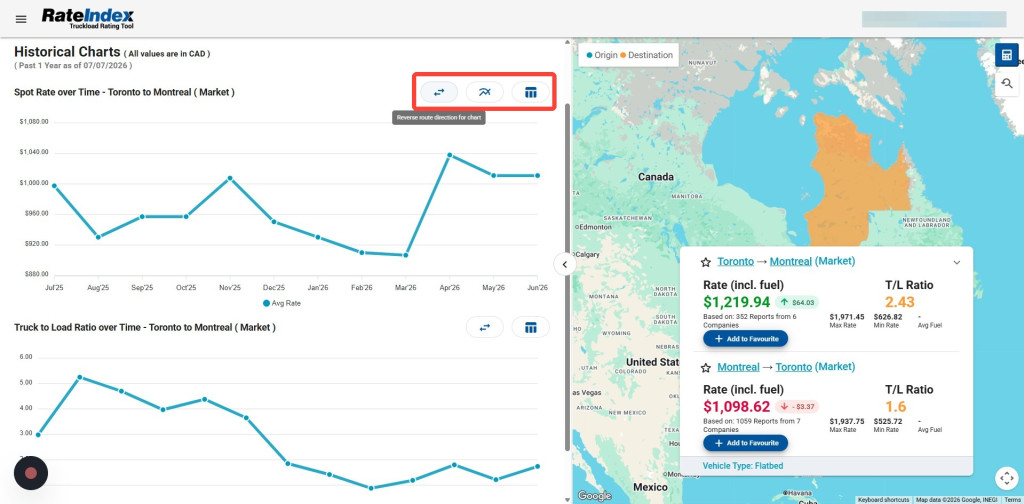
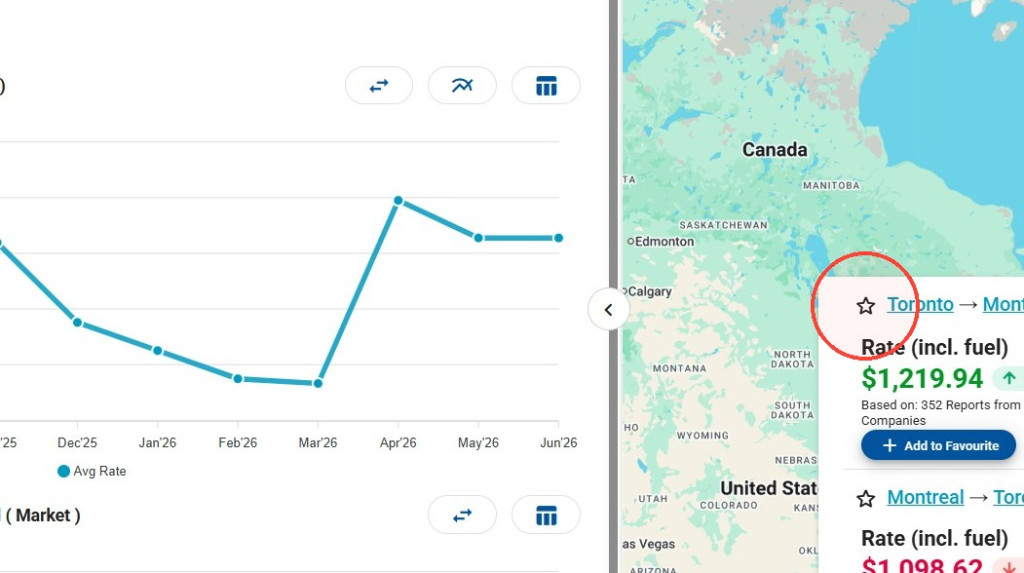
Choose the headhaul or return-trip lane. Use Split Chart to compare minimum, average, and maximum reported rates, or select Table View to review exact values.
Review Capacity Trends
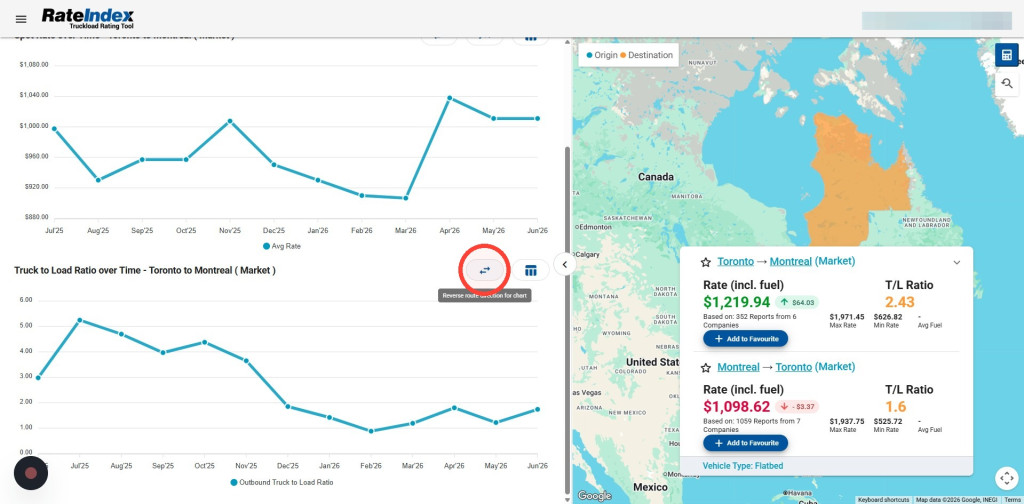
Review the historical truck-to-load chart to compare capacity conditions over time. Select Reverse Route to review the return direction.
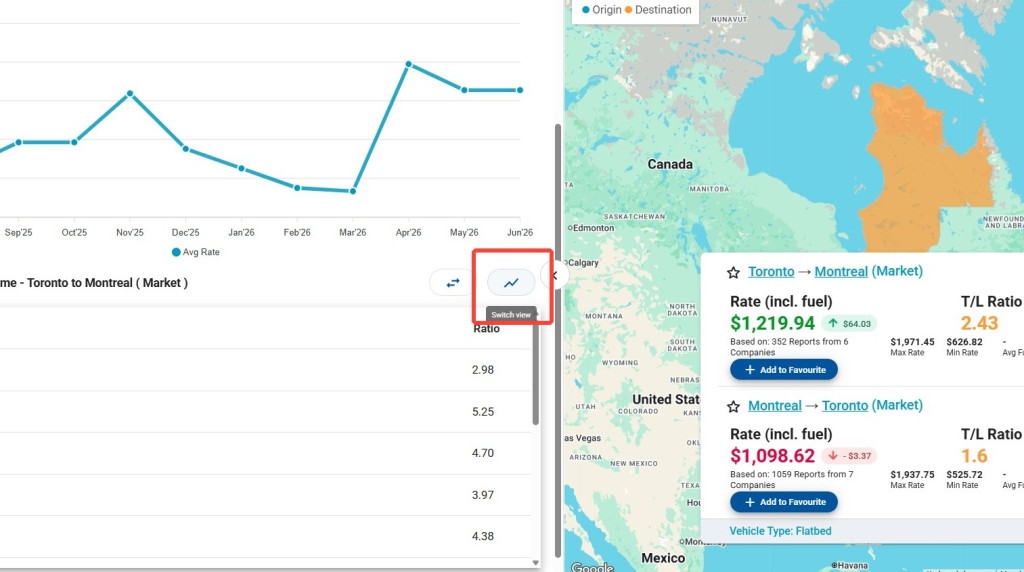
You can also view this data in either a line graph or table format.
Save and Reopen Favourite Lanes
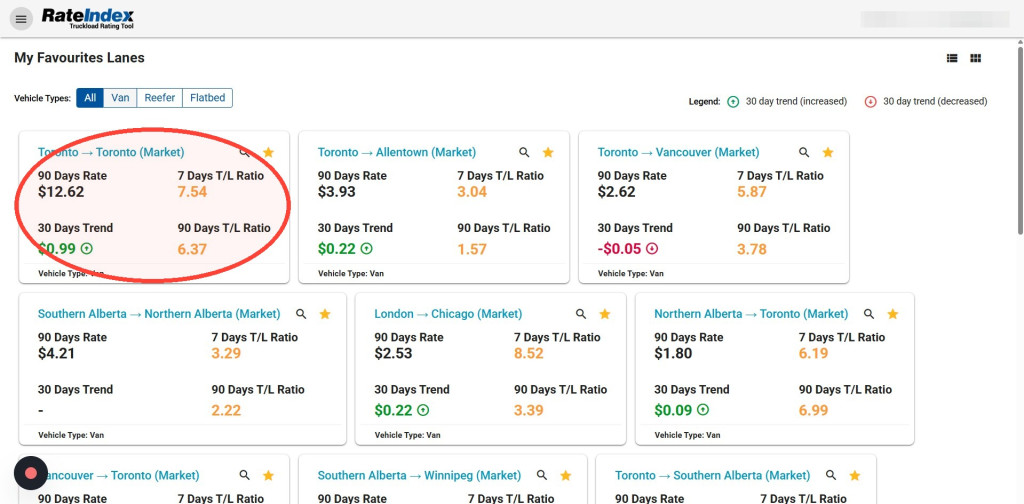
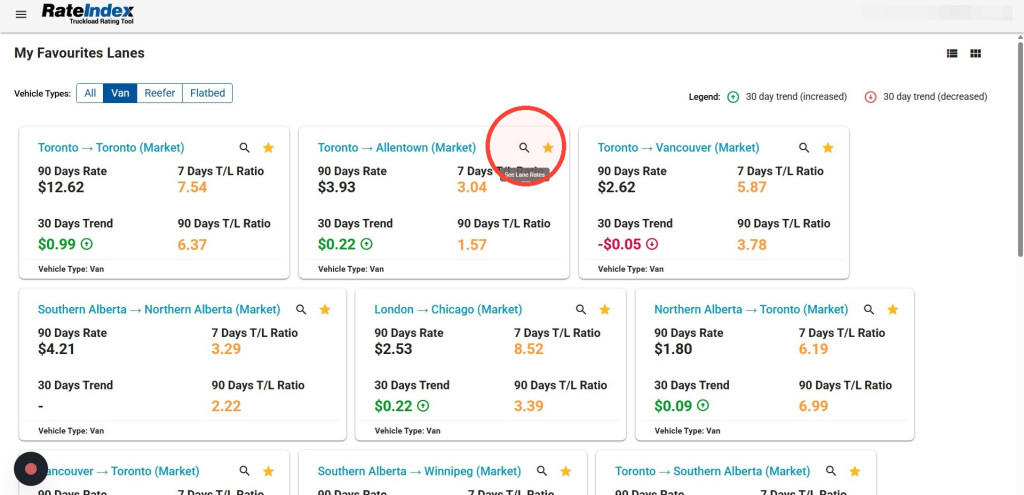
Select Favourites from the sidebar to review your saved lanes.
Each favourite card displays:
– 90-day average rate – 30-day rate trend – 7-day truck-to-load ratio – 90-day truck-to-load ratio
Select the Search icon on a favourite card to reopen that lane in the Lane Rate workspace.
Compare Regional Rates
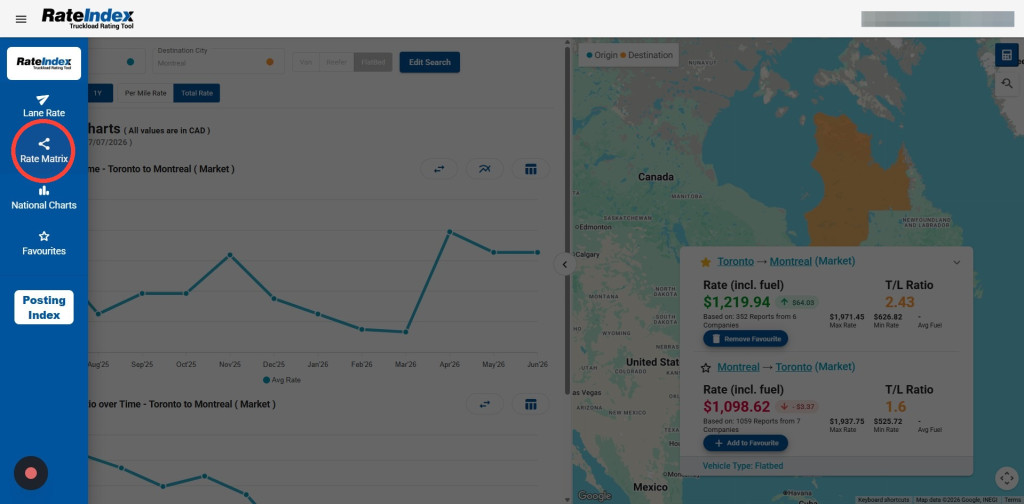
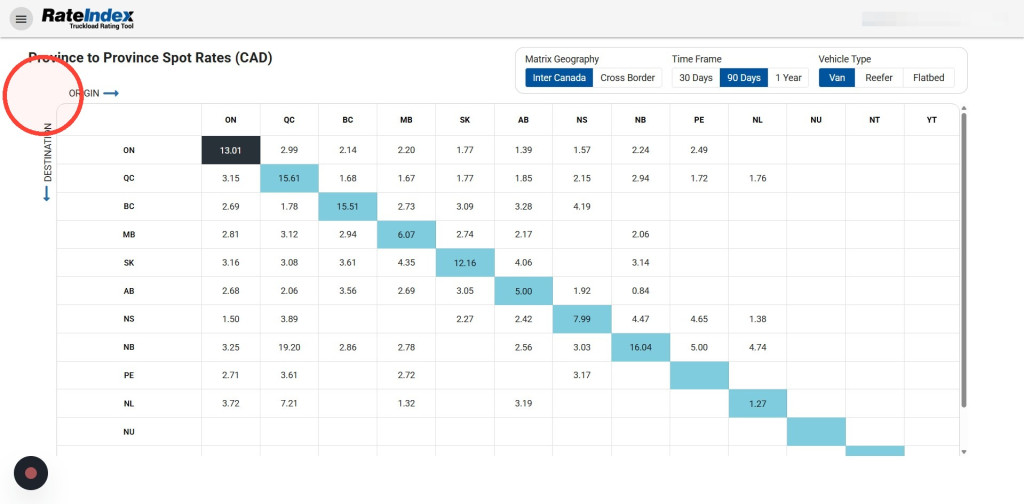
Select Rate Matrix to compare average reported rates across Canadian provinces or cross-border markets.
Use the row and column headings to locate the origin and destination.
The intersecting cell displays the available average reported rate in Canadian dollars.
You can choose a timeframe and equipment type to adjust the rates shown in the matrix.
Tip!
Inter-province rates will be highlighted in blue
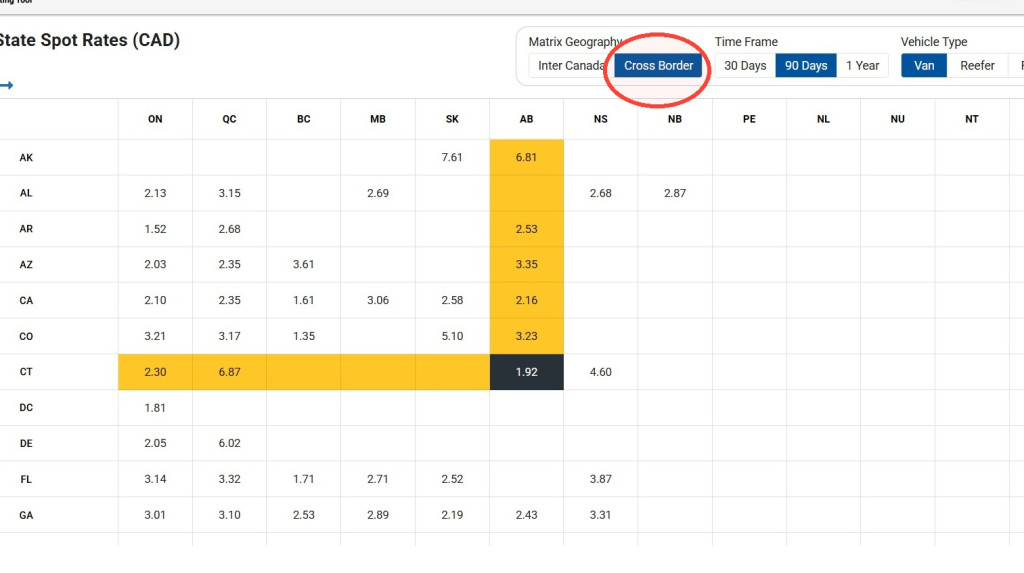
Select Cross Border to compare Canada-US lanes. Choose a timeframe and equipment type to adjust the rates shown in the matrix.